The probability that S&P would head down to 1500 did not materialize obviously however it did get down to 1800, before turning around. Though the depth of the fall was not as deep as anticipated, the subsequent turn-around and climb back up pattern matches the general pattern seen in the smaller time frame oil charts in the previous posts, where price climbs all the way back up to previous levels.
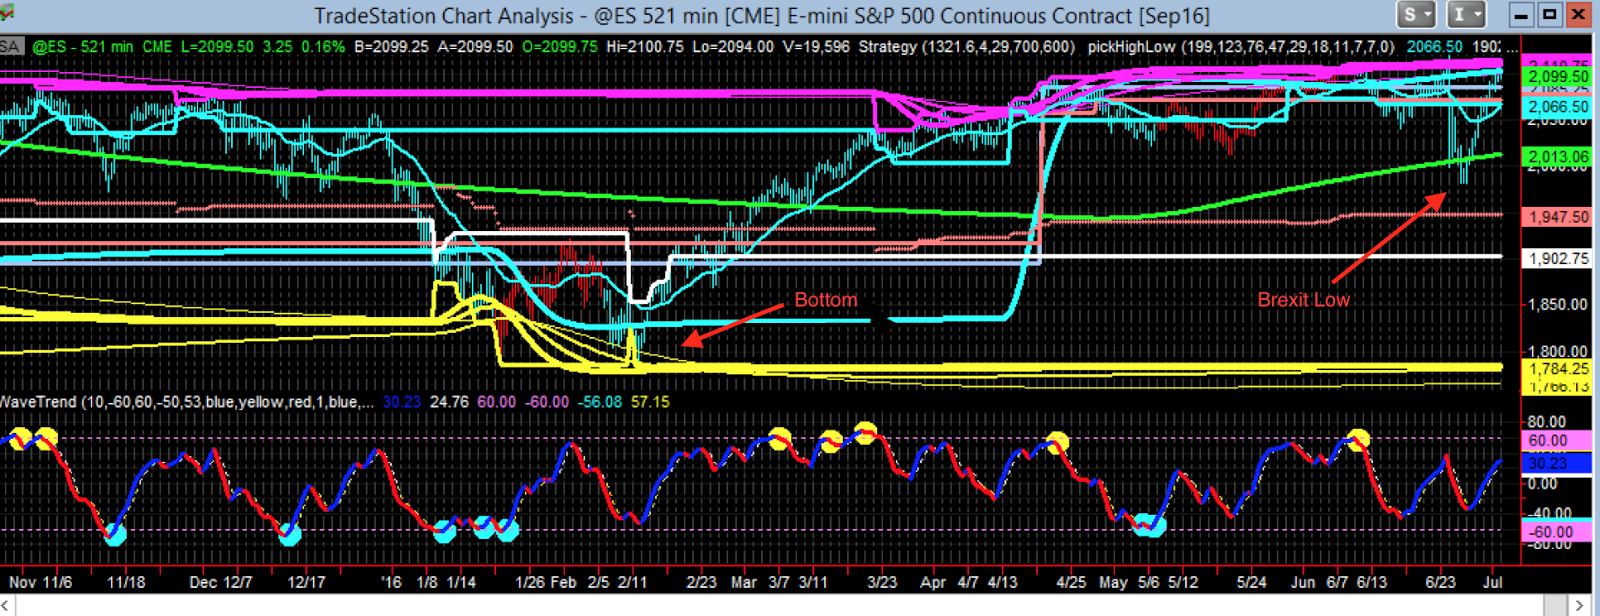
See chart below 521 minute ES with several different chaos indicator curves, it is rather clear why the turn-around from 1800 was not surprising. The recent Brexit spike down is also seen in this chart, and obvious there is the support green chaos indicator line at 2013.06

The question now of course is where to next? Consider the daily ES chart and the smaller 123 minute ES chart captures the pattern. It suggests some bullish shaped
side-ways movement and a
subsequent fall is in the works. ES could move up to the 2150 even 2170 range prior to taking a turn back down to the 1980 range. It looks like upward movement that is essentially works out to side-way and then falls back down, the key thing is that it is very unlikely to exceed 2180, that would be the absolute top for the rest of the year, and it may not even get there and start heading down. The initial downward slide target would be something like the 1980s or 2000 range. The time-frame for all these is the rest of the current year to early next year. It would be very surprising if it moved past 2180 and kept going on upwards would be extraordinary and unexpected. The pattern is evident in the 123 minute ES from the past market action on that chart.